Fig. 3
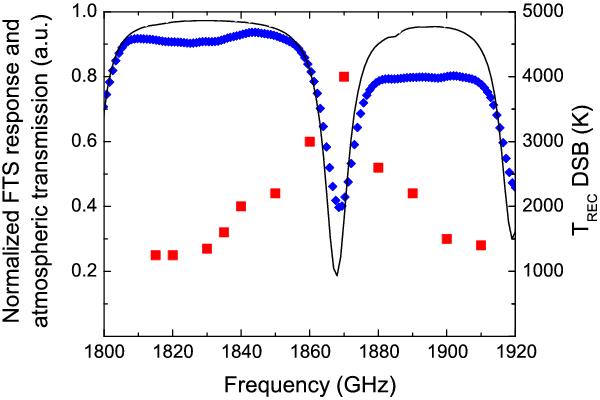
Measured spectral response of the L2-channel flight mixer: The red squares are the uncorrected Trec (DSB) vs. local oscillator frequency measured with the GREAT system at the ground-support facility in Dryden. The blue diamonds are the normalized direct-detection response measured in a test cryostat with the FTS setup at the Cologne lab. The absorption feature in the FTS response at 1868 GHz is caused by water in the beam path. The black solid line is the calculated atmospheric transmission for the FTS setup in Cologne.
Current usage metrics show cumulative count of Article Views (full-text article views including HTML views, PDF and ePub downloads, according to the available data) and Abstracts Views on Vision4Press platform.
Data correspond to usage on the plateform after 2015. The current usage metrics is available 48-96 hours after online publication and is updated daily on week days.
Initial download of the metrics may take a while.