Fig. B.2
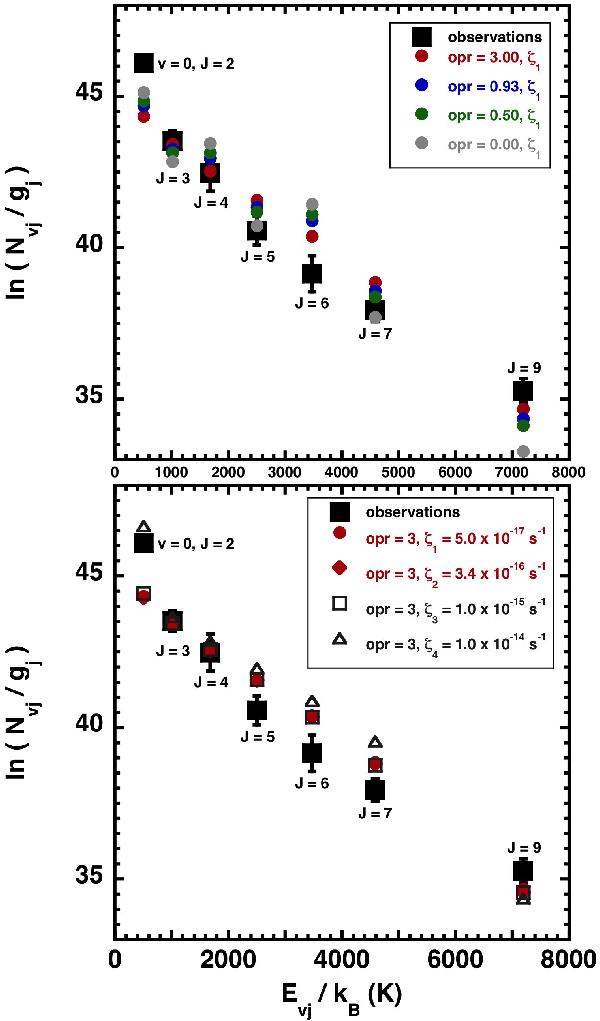
H2 excitation diagram comparisons. Upper panel: evolution of the modelled excitation diagram obtained for ζ1 = 5 × 10-17 s-1, varying the initial value of the OPR from the unrealistic, extreme-case 0 value to its equilibrium one, 3. Lower panel: influence of the cosmic ray ionisation rate variation on our modelled excitation diagram, with the initial OPR set to 3.
Current usage metrics show cumulative count of Article Views (full-text article views including HTML views, PDF and ePub downloads, according to the available data) and Abstracts Views on Vision4Press platform.
Data correspond to usage on the plateform after 2015. The current usage metrics is available 48-96 hours after online publication and is updated daily on week days.
Initial download of the metrics may take a while.