Fig. B.1
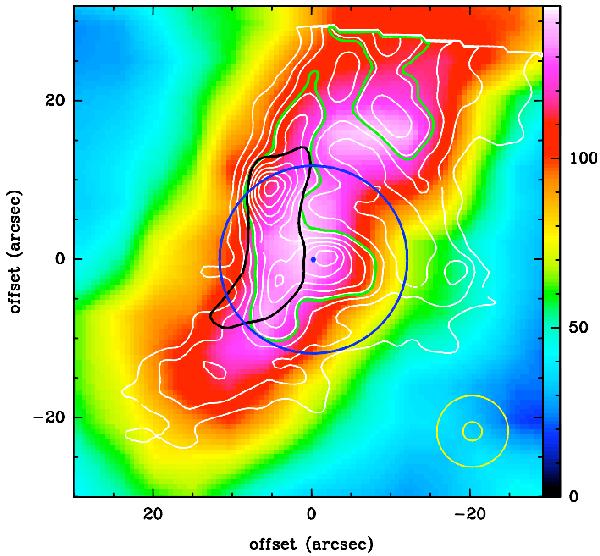
Overlay of the map of CO (6–5) emission observed by the APEX telescope (colour background) with the H2 0–0 S(5) emission (white contours), observed with the Spitzer telescope. The wedge unit is K km s-1 (antenna temperature) and refers to the CO observations. The H2 0–0 S(5) contours are from 50 to 210σ, in steps of 20σ ≃ 1.6 × 10⁻⁴ erg cm-2 s-1 sr-1. The green contour defines the half-maximum contour of this transition. Like in Fig. 1, the blue circle indicates the beam size of the SOFIA/GREAT observations, on the position of the centre of the circle, marked by a blue dot. The beam and pixel sizes of the CO (6–5), and H2 0–0 S(5) observations are also provided in yellow (big and small, respectively) circles in the lower right corner. The black contour delineates the half-maximum contour of the H2 0–0 S(2) transition. The field is smaller than in Fig. 1, and the (0, 0) position is that of the Spitzer observations (see Appendix B).
Current usage metrics show cumulative count of Article Views (full-text article views including HTML views, PDF and ePub downloads, according to the available data) and Abstracts Views on Vision4Press platform.
Data correspond to usage on the plateform after 2015. The current usage metrics is available 48-96 hours after online publication and is updated daily on week days.
Initial download of the metrics may take a while.