Free Access
Fig. A.1
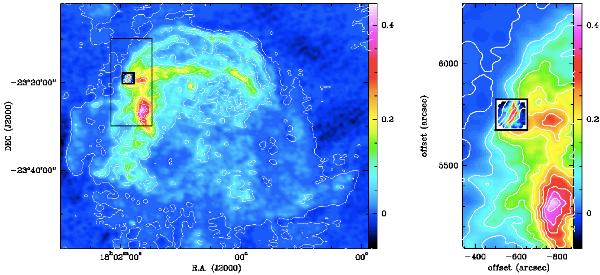
Location of the field covered by our CO observations on the larger-scale radio continuum image at 327 MHz taken from Claussen et al. (1997): entire SNR in the left panel, zoom in the right panel. The shown CO observations are the (6–5) map, also displayed in Fig. 1.
Current usage metrics show cumulative count of Article Views (full-text article views including HTML views, PDF and ePub downloads, according to the available data) and Abstracts Views on Vision4Press platform.
Data correspond to usage on the plateform after 2015. The current usage metrics is available 48-96 hours after online publication and is updated daily on week days.
Initial download of the metrics may take a while.