Fig. 2
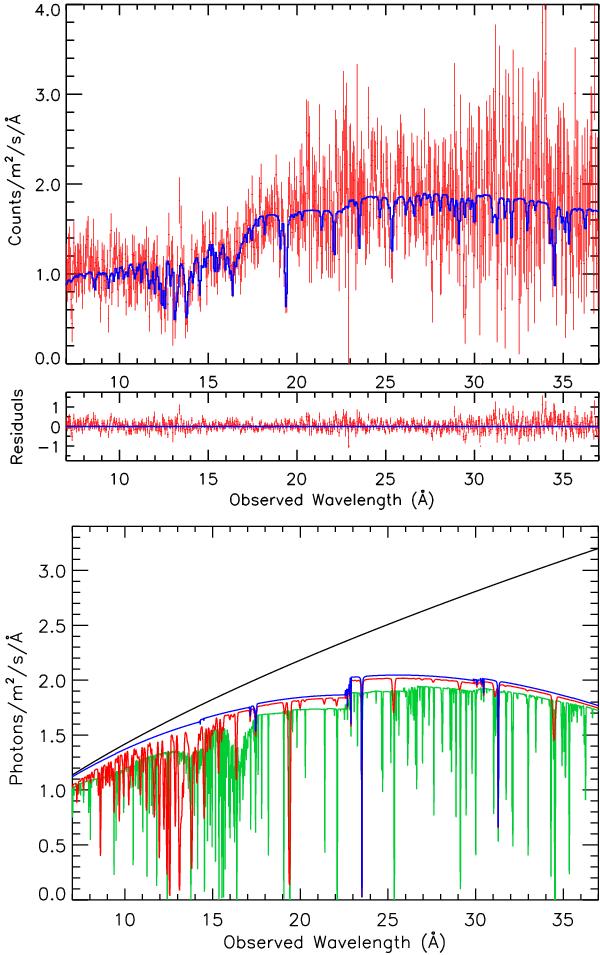
Top panel: RGS spectrum of ESO 113-G010, fitted using the two-phase xabsmodel described in Sect. 4 and SED E in Fig. 4. The data are shown in red and the model in blue. Residuals of the fit, (Observed − Model)/Model, are displayed below the panel. Bottom panel: the absorption components of the best-fit RGS model as described in Sect. 4, with the best-fit parameters of the model given in Table 1. The blue component shows the Galactic absorption applied to the power-law continuum (in black). The two warm absorber phases (Phase 1 in red and Phase 2 in green) are applied separately to the Galactic-absorbed continuum, showing how each phase contributes to the absorption.
Current usage metrics show cumulative count of Article Views (full-text article views including HTML views, PDF and ePub downloads, according to the available data) and Abstracts Views on Vision4Press platform.
Data correspond to usage on the plateform after 2015. The current usage metrics is available 48-96 hours after online publication and is updated daily on week days.
Initial download of the metrics may take a while.