Free Access
Fig. 1
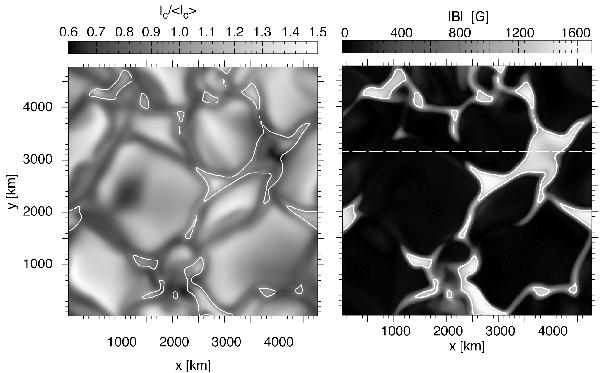
Initial state. Left: emerging radiative intensity at the top boundary. Right: magnetic field strength on the τ = 1 surface of the initial model. The horizontal line indicates the position of the vertical slice shown in Fig. 3. The contours in both panels display the equipartition level where cs = cA.
Current usage metrics show cumulative count of Article Views (full-text article views including HTML views, PDF and ePub downloads, according to the available data) and Abstracts Views on Vision4Press platform.
Data correspond to usage on the plateform after 2015. The current usage metrics is available 48-96 hours after online publication and is updated daily on week days.
Initial download of the metrics may take a while.