Fig. 4
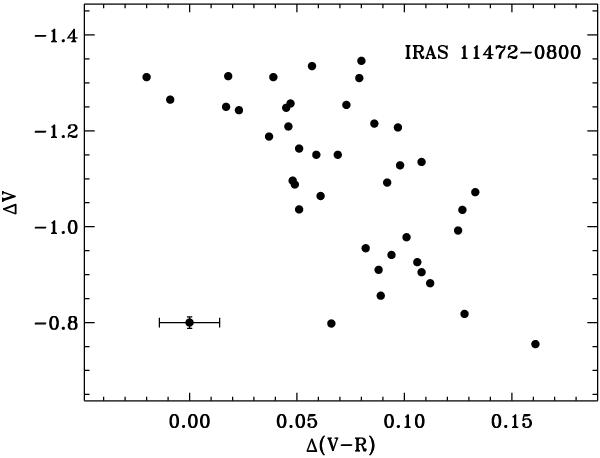
Colour–magnitude diagram for IRAS 11472–0800 from 2003–2008, showing that the object is generally redder when fainter during its pulsational variability. A standard error bar is shown for reference in the lower left corner. (Note that we have not included the four points from 1995–1999 when the overall brightness was higher.)
Current usage metrics show cumulative count of Article Views (full-text article views including HTML views, PDF and ePub downloads, according to the available data) and Abstracts Views on Vision4Press platform.
Data correspond to usage on the plateform after 2015. The current usage metrics is available 48-96 hours after online publication and is updated daily on week days.
Initial download of the metrics may take a while.