Fig. 1
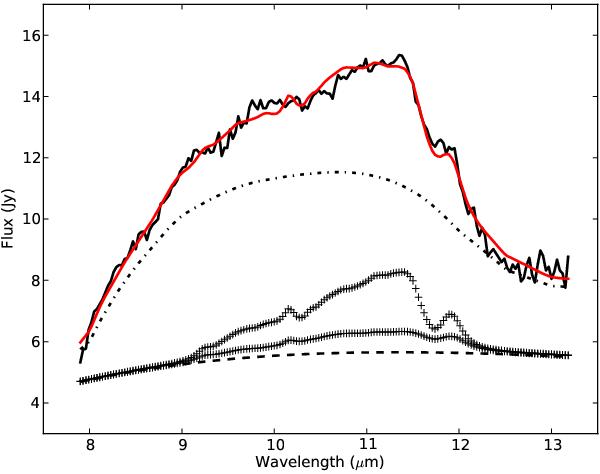
Observed N-band spectrum of IRAS 11472–0800 is shown as the solid black line. The different lines represent our decomposition of the different dust species contributing to the silicate emission feature. The dashed line represents the continuum, the dashed-dotted line the contribution of large grains of amorphous silicates and the + are large (lower) and small (upper) grains of forsterite, the Mg-rich end member of the crystalline olivine. The total model spectrum is depicted in red.
Current usage metrics show cumulative count of Article Views (full-text article views including HTML views, PDF and ePub downloads, according to the available data) and Abstracts Views on Vision4Press platform.
Data correspond to usage on the plateform after 2015. The current usage metrics is available 48-96 hours after online publication and is updated daily on week days.
Initial download of the metrics may take a while.