Free Access
Fig. 8
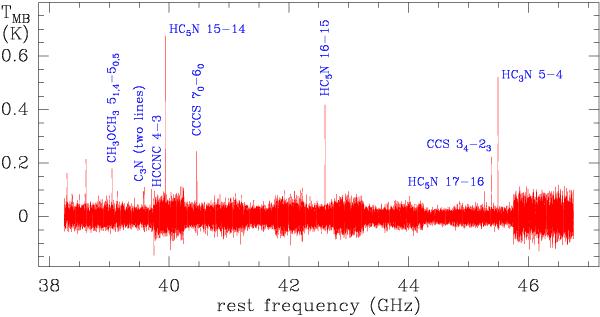
8.5 GHz bandwidth spectrum toward TMC-1. The full spectrum is a composite of individual scans of 1.5 GHz of bandwidth. Integration time of individual scans ranges from 3 to 8 min, which is easy to note by different noise levels. Some of the identified lines are also indicated.
Current usage metrics show cumulative count of Article Views (full-text article views including HTML views, PDF and ePub downloads, according to the available data) and Abstracts Views on Vision4Press platform.
Data correspond to usage on the plateform after 2015. The current usage metrics is available 48-96 hours after online publication and is updated daily on week days.
Initial download of the metrics may take a while.