Fig. 4
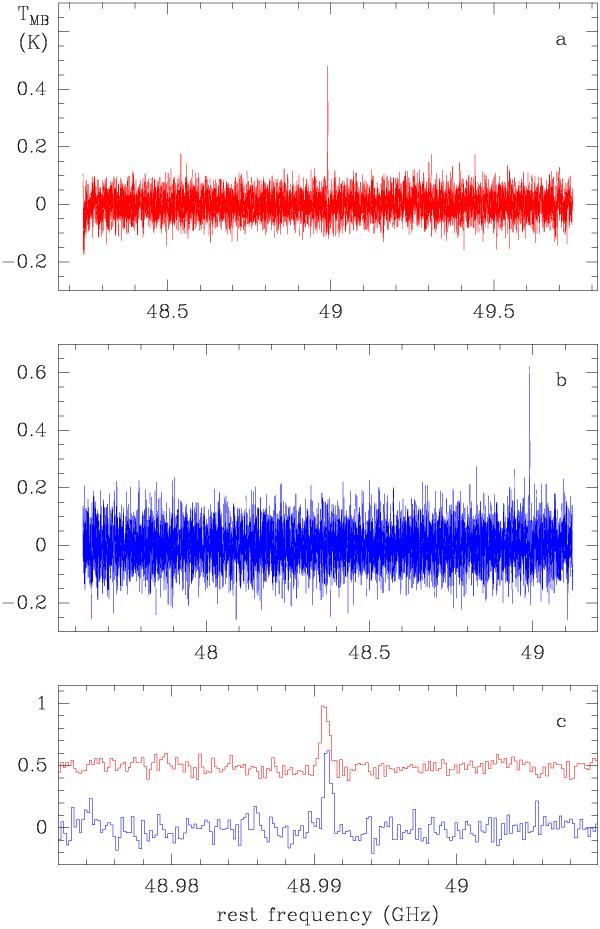
CS J = 1 → 0 line observed toward W3(OH). a) Line frequency in the band center. b) Line frequency next to an edge of the band. c) A 40-MHz zoom of both spectra centered at the line. The comparison of both spectra is satisfactory, both in frequency and intensity scale. The upper spectrum a) is less noisy than the lower one b) owing to different integration times (8 and 3 min, respectively).
Current usage metrics show cumulative count of Article Views (full-text article views including HTML views, PDF and ePub downloads, according to the available data) and Abstracts Views on Vision4Press platform.
Data correspond to usage on the plateform after 2015. The current usage metrics is available 48-96 hours after online publication and is updated daily on week days.
Initial download of the metrics may take a while.