Free Access
Fig. 7
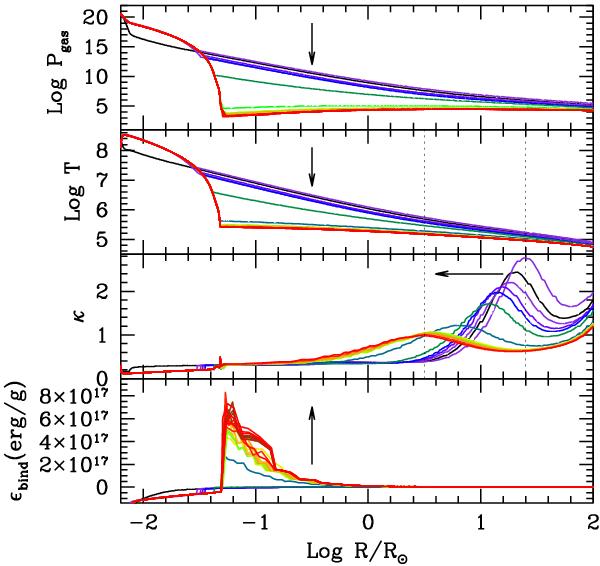
First panel: Log Pgas; second panel: Log T; third panel: κ; fourth panel: ϵbind versus the logarithm of radius, Log R near the zone of the instability for some selected models prior to the divergence. The arrows indicate the direction in which time increases.
Current usage metrics show cumulative count of Article Views (full-text article views including HTML views, PDF and ePub downloads, according to the available data) and Abstracts Views on Vision4Press platform.
Data correspond to usage on the plateform after 2015. The current usage metrics is available 48-96 hours after online publication and is updated daily on week days.
Initial download of the metrics may take a while.