Free Access
Fig. 6
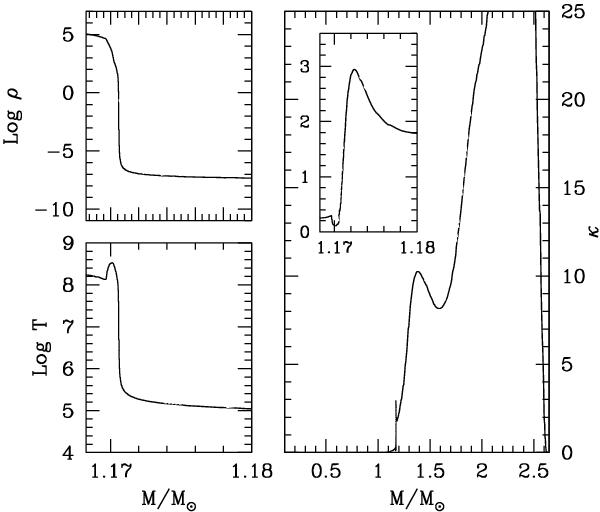
Left upper panel: mass coordinate versus density near the κFe peak. Left lower panel: mass coordinate versus temperature near the κFe peak. Right panel: opacity profile versus mass. The insert corresponds to the κFe peak.
Current usage metrics show cumulative count of Article Views (full-text article views including HTML views, PDF and ePub downloads, according to the available data) and Abstracts Views on Vision4Press platform.
Data correspond to usage on the plateform after 2015. The current usage metrics is available 48-96 hours after online publication and is updated daily on week days.
Initial download of the metrics may take a while.