Free Access
Fig. 2
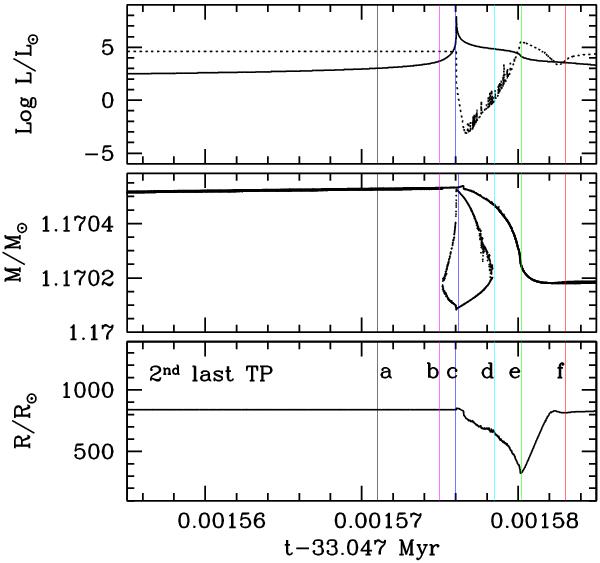
Upper panel: evolution of luminosity associated to H-burning (dotted line) and He-burning (solid line); middle panel: evolution of convection; lower panel: evolution of the surface radius, all during the second last thermal pulse. Relevant structure profiles of models labelled a to f appear in Fig. 8.
Current usage metrics show cumulative count of Article Views (full-text article views including HTML views, PDF and ePub downloads, according to the available data) and Abstracts Views on Vision4Press platform.
Data correspond to usage on the plateform after 2015. The current usage metrics is available 48-96 hours after online publication and is updated daily on week days.
Initial download of the metrics may take a while.