Fig. 6
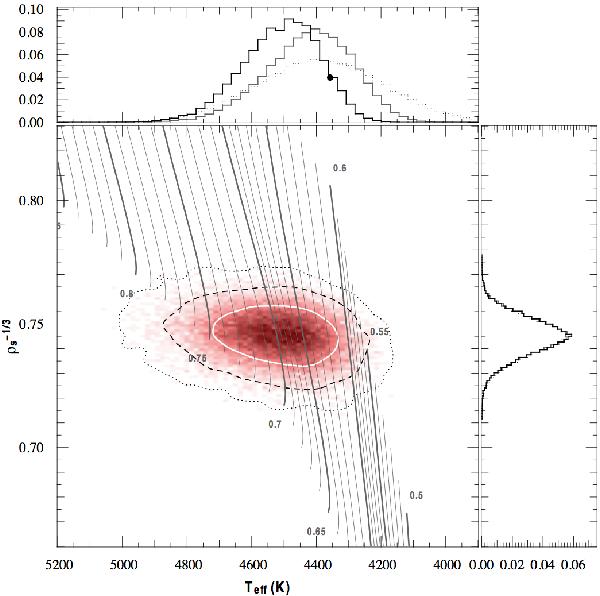
Main panel: modifield Herztsprung-Russell diagram showing the posterior PDF of  as a function of Teff after interpolating with the Geneva stellar evolution tracks for stars on the main sequence. Masses are indicated and correspond to the bold tracks. The solid, dashed and dotted lines correspond to the 1-σ, 2-σ and 3-σ contours, respectively. Secondary panels: marginalised PDF of and Teff. In both panels, there are three histograms: dotted: input distribution; gray: output distribution; black: output distribution for ages < 12 Gyr.
Current usage metrics show cumulative count of Article Views (full-text article views including HTML views, PDF and ePub downloads, according to the available data) and Abstracts Views on Vision4Press platform.
Data correspond to usage on the plateform after 2015. The current usage metrics is available 48-96 hours after online publication and is updated daily on week days.
Initial download of the metrics may take a while.