Fig. 4
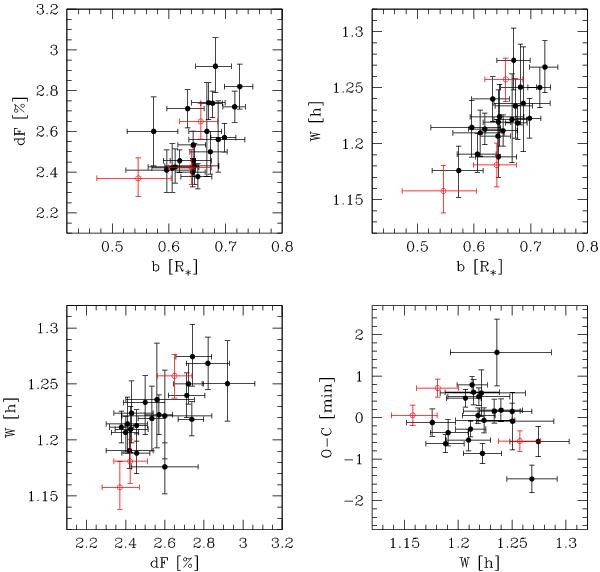
Correlation diagrams for the transit parameters deduced from the individual MCMC analysis of the 23 transit light curves. Top left: transit depth vs. transit impact parameter. Top right: transit duration vs. transit impact parameter. Bottom left: transit duration vs. transit depth. Bottom right: TTV (observed minus calculated transit timing) vs. transit duration. The filled black and open red symbols correspond, respectively, to the TRAPPIST and Euler light curves.
Current usage metrics show cumulative count of Article Views (full-text article views including HTML views, PDF and ePub downloads, according to the available data) and Abstracts Views on Vision4Press platform.
Data correspond to usage on the plateform after 2015. The current usage metrics is available 48-96 hours after online publication and is updated daily on week days.
Initial download of the metrics may take a while.