Fig. 2
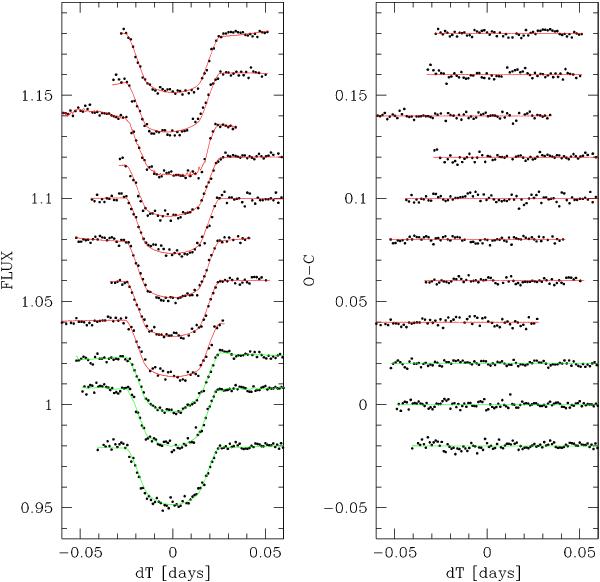
Left: WASP-43 b transit photometry (8 last TRAPPIST transits + the 3 Euler transits) used in this work, binned per 2 min, period-folded on the best-fit transit ephemeris deduced from our global MCMC analysis (see Sect. 3.3), and shifted along the y-axis for clarity. The best-fit baseline+transit models are superimposed on the light curves (red = TRAPPIST I + z filter; green = Euler Gunn-r′ filter). The third, ninth and tenth models (from the top) show some wiggles because of their position-dependent terms. Right: best-fit residuals for each light curve binned per interval of 2 min.
Current usage metrics show cumulative count of Article Views (full-text article views including HTML views, PDF and ePub downloads, according to the available data) and Abstracts Views on Vision4Press platform.
Data correspond to usage on the plateform after 2015. The current usage metrics is available 48-96 hours after online publication and is updated daily on week days.
Initial download of the metrics may take a while.