Fig. 10
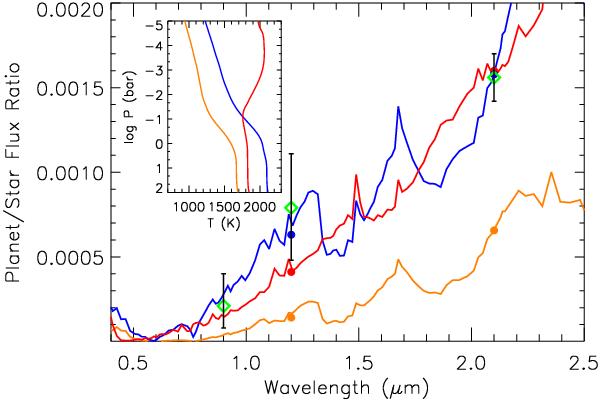
Model planet-to-star flux ratios compare to the three data points. The data are green diamonds with 1 − σ error bars shown. The orange model assumes planet-wide redistribution of absorbed flux. The red and blue models assume no redistribution of absorbed flux, to maximize the day-side temperature. The red model includes gaseous TiO and VO and has a temperature inversion. (See the figure inset.) The blue and orange models have TiO and VO opacity removed, and do not have a temperature inversion. For each model, filled circles are model fluxes averaged over each bandpass. The data slightly favor a model with no day-side temperature inversion.
Current usage metrics show cumulative count of Article Views (full-text article views including HTML views, PDF and ePub downloads, according to the available data) and Abstracts Views on Vision4Press platform.
Data correspond to usage on the plateform after 2015. The current usage metrics is available 48-96 hours after online publication and is updated daily on week days.
Initial download of the metrics may take a while.