Free Access
Fig. 4
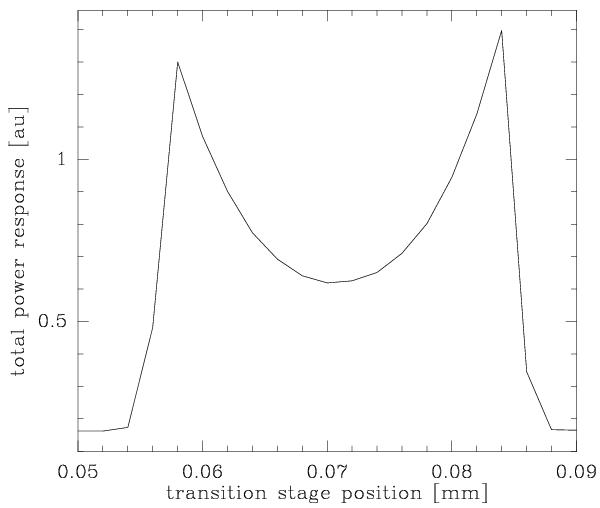
Total power response of the HEB mixer versus diplexer roof top position. The shape of the curve results from decreasing mixer gain with increasing LO pump power (see Pütz et al. 2012, for details). Noise temperature and stability of the system are best at the response minimum.
Current usage metrics show cumulative count of Article Views (full-text article views including HTML views, PDF and ePub downloads, according to the available data) and Abstracts Views on Vision4Press platform.
Data correspond to usage on the plateform after 2015. The current usage metrics is available 48-96 hours after online publication and is updated daily on week days.
Initial download of the metrics may take a while.