Fig. 9
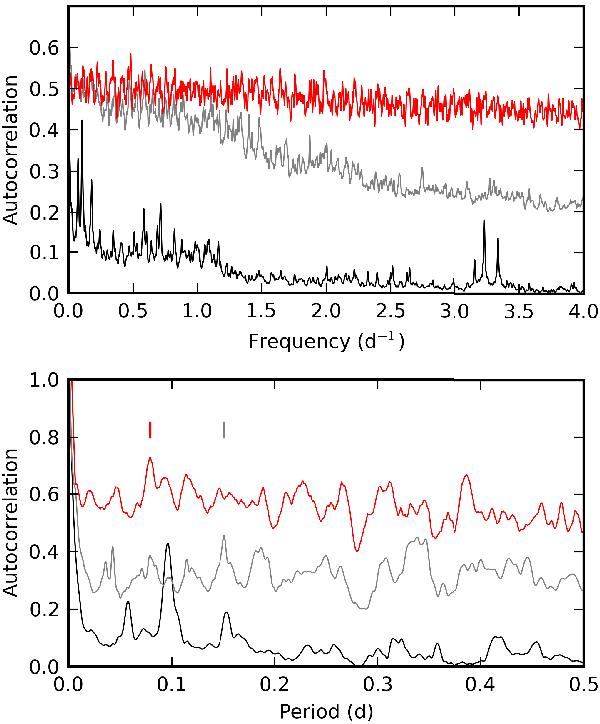
Upper panel: autocorrelation function of the full power spectrum in frequency space. The autocorrelation of the original power spectrum is plotted in black, the one of the power spectrum after prewhitening the 6 strongest peaks is plotted in grey, and then one of the 252 significant frequencies given an artificial power while all others given zero power in red. Lower panel: autocorrelation functions of the power spectrum between 0.5 d-1 and 2 d-1, converted into period space (colours have the same meaning). Candidate spacings are marked with a thick vertical line using a colour according to the corresponding function.
Current usage metrics show cumulative count of Article Views (full-text article views including HTML views, PDF and ePub downloads, according to the available data) and Abstracts Views on Vision4Press platform.
Data correspond to usage on the plateform after 2015. The current usage metrics is available 48-96 hours after online publication and is updated daily on week days.
Initial download of the metrics may take a while.