Fig. 8
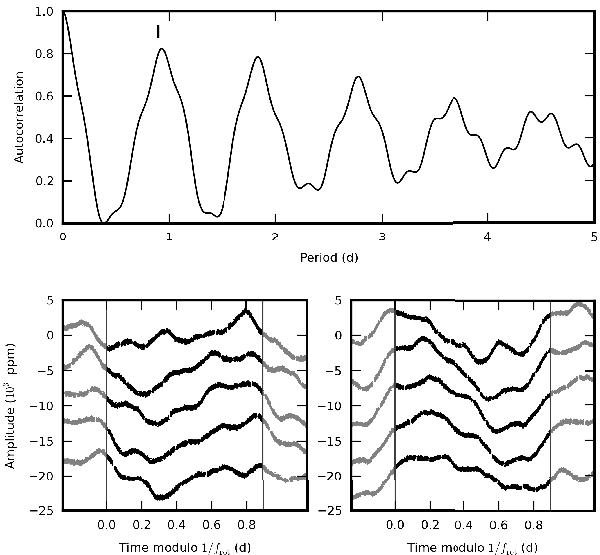
Upper panel: autocorrelation function of the CoRoT light curve. The period corresponding to the proposed frot rotational frequency is marked with a thick vertical line. The same scaling is used as for Fig. 9. Lower panels: sample consecutive cuts of the CoRoT light curve according to a period of 1/frot showing strong similarities. For better visibility the previous and following cuts are also plotted in grey, while the consecutive orders are shifted downwards by 5000 ppm.
Current usage metrics show cumulative count of Article Views (full-text article views including HTML views, PDF and ePub downloads, according to the available data) and Abstracts Views on Vision4Press platform.
Data correspond to usage on the plateform after 2015. The current usage metrics is available 48-96 hours after online publication and is updated daily on week days.
Initial download of the metrics may take a while.