Fig. 7
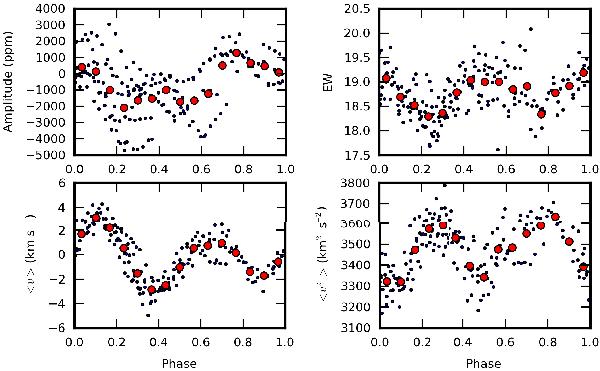
Phase-plots using the rotation frequency frot = 1.114997 d-1. Upper left: the subset of CoRoT data averaged over the HARPS integration times when simultaneous spectroscopy is available. The cycle-to-cycle variations are due to the dominant pulsation modes. Upper right: the EW; lower panels: ⟨ v ⟩ and ⟨ v2 ⟩ of the He i line at 6678 Å. The small symbols are observations, while the larger red circles are phase-binned averages.
Current usage metrics show cumulative count of Article Views (full-text article views including HTML views, PDF and ePub downloads, according to the available data) and Abstracts Views on Vision4Press platform.
Data correspond to usage on the plateform after 2015. The current usage metrics is available 48-96 hours after online publication and is updated daily on week days.
Initial download of the metrics may take a while.