Fig. 6
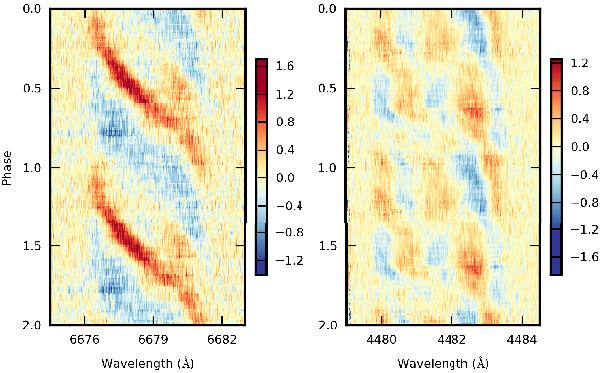
A colour scale representation of the residual spectral lines with respect to the average line for the selected He and Mg line of HD 43317. The phase corresponds to the dominant period found through the pixel-by-pixel method, colours denote deviations from the average profile in percentage. For better visibility of the patterns, two cycles are shown, and we have applied an S/N-weighted sliding boxcar smoothing with a bin width of 0.05 and a step size of 0.005 cycles. Left: phase-plot for the He i line at 6678 Å using the dominant frequency of 2.228748 d-1. Right: phase-plot for the Mg ii line at 4481 Å using the dominant frequency of 1.354276 d-1.
Current usage metrics show cumulative count of Article Views (full-text article views including HTML views, PDF and ePub downloads, according to the available data) and Abstracts Views on Vision4Press platform.
Data correspond to usage on the plateform after 2015. The current usage metrics is available 48-96 hours after online publication and is updated daily on week days.
Initial download of the metrics may take a while.