Fig. 5
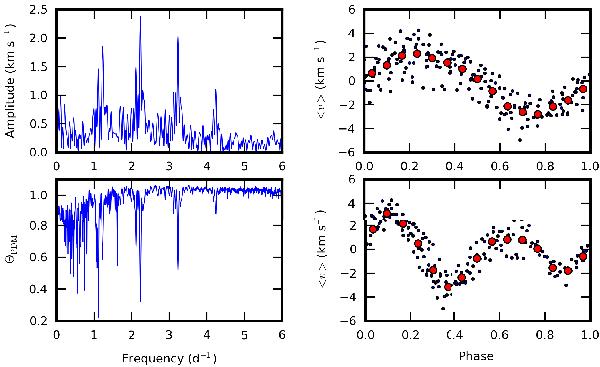
Upper left: scargle periodogram of ⟨ v ⟩ of the He i line at 6678 Å with the highest peak at ~2.23 d-1. Upper right: phase-plot of ⟨ v ⟩ according to the frequency fm = 2.228748 d-1. The small symbols are observations, while the larger red circles are phase-binned averages. Lower left: ΘPDM-statistics of ⟨ v ⟩ , showing the deepest minimum at fm/2. Lower right: phase-plot of ⟨ v ⟩ according to the frequency fm/2.
Current usage metrics show cumulative count of Article Views (full-text article views including HTML views, PDF and ePub downloads, according to the available data) and Abstracts Views on Vision4Press platform.
Data correspond to usage on the plateform after 2015. The current usage metrics is available 48-96 hours after online publication and is updated daily on week days.
Initial download of the metrics may take a while.