Fig. 4
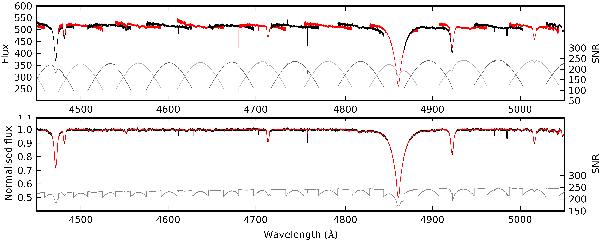
Upper panel: a typical raw HARPS spectrum (consecutive orders plotted with a different colour for better visibility). Lower panel: the same spectrum after order merging, normalisation, and the removal of cosmics which were not removed by the standard pipeline (with the average of all spectra also plotted in red). Signal-to-noise levels are also plotted order-by-order and for the merged spectrum. Detailed explanation of the process can be found in the text.
Current usage metrics show cumulative count of Article Views (full-text article views including HTML views, PDF and ePub downloads, according to the available data) and Abstracts Views on Vision4Press platform.
Data correspond to usage on the plateform after 2015. The current usage metrics is available 48-96 hours after online publication and is updated daily on week days.
Initial download of the metrics may take a while.