Fig. 3
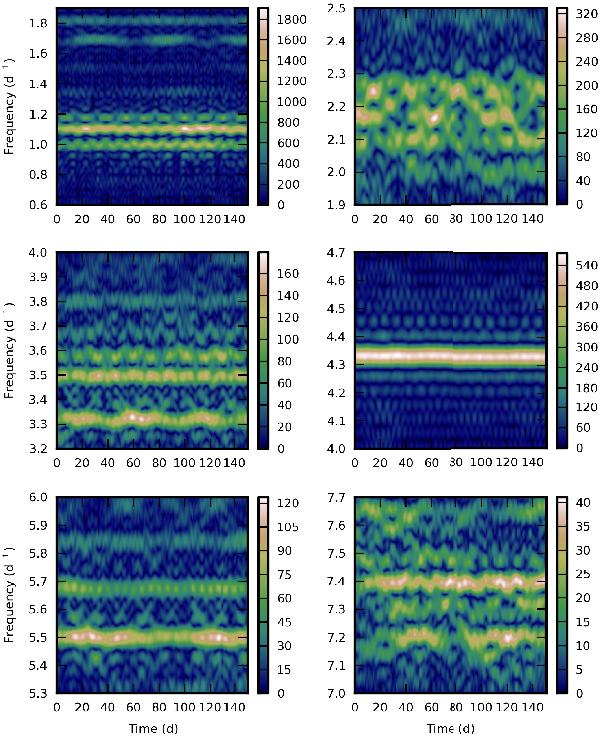
Short-time Fourier transformations of selected regions of the power spectrum (window width of 20 d, colours denote amplitude in ppm). All signal outside these regions was removed before the calculation. Although closely spaced peaks might introduce complicated beating patterns (upper right), frequencies appear through the whole light curve.
Current usage metrics show cumulative count of Article Views (full-text article views including HTML views, PDF and ePub downloads, according to the available data) and Abstracts Views on Vision4Press platform.
Data correspond to usage on the plateform after 2015. The current usage metrics is available 48-96 hours after online publication and is updated daily on week days.
Initial download of the metrics may take a while.