Fig. 10
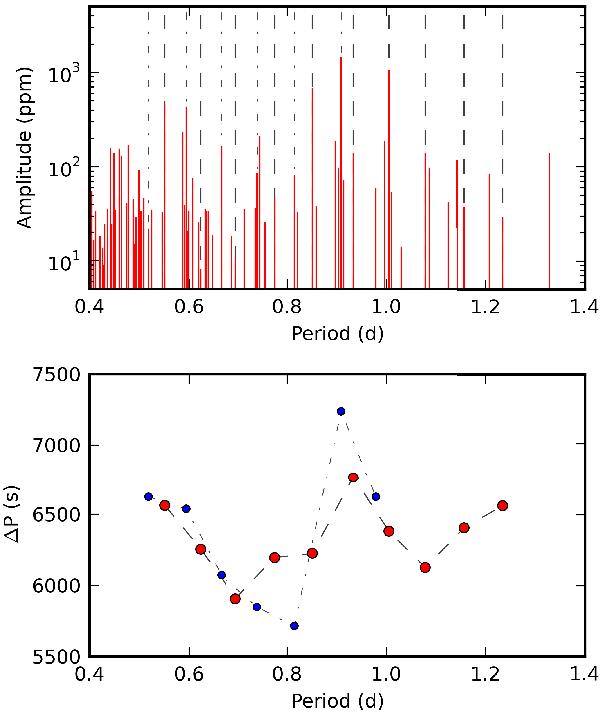
Upper panel: the period spectrum of the CoRoT light curve of HD 43317 (red solid lines), with the locations of the members of the two longest series with almost constant period spacing in grey dashed, and dash-dotted lines. Lower panel: the deviations from the average period spacings are indicated through line connections between the members of the two series.
Current usage metrics show cumulative count of Article Views (full-text article views including HTML views, PDF and ePub downloads, according to the available data) and Abstracts Views on Vision4Press platform.
Data correspond to usage on the plateform after 2015. The current usage metrics is available 48-96 hours after online publication and is updated daily on week days.
Initial download of the metrics may take a while.