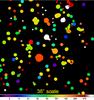
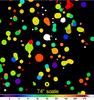
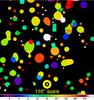
Fig. 9
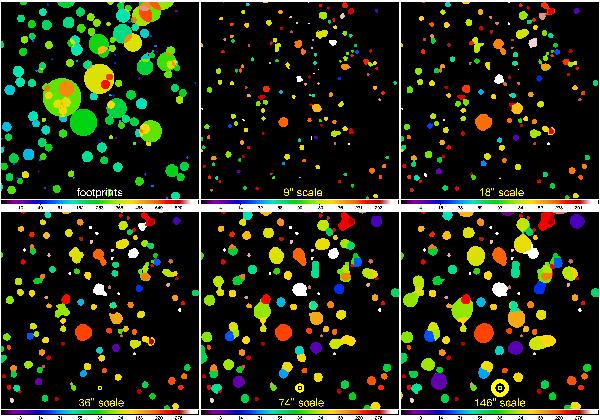
Single-scale source detection (Sect. 2.5). The field of Fig. 2 is shown as the initial footprint image ℱD after the source detection (upper left). The same set of spatial scales is displayed in the single-scale segmentation images ℐDj S (left to right, top to bottom) showing the source segmentation masks determined from ℐDj C (Fig. 7). The masks were obtained and analyzed by the detection procedure described in Sect. 2.5. The scale sizes Sj are visualized by the yellow-black circles and annotated at the bottom of the panels. The color coding is a function of the square root of the source number (which makes up the actual pixel values in these segmentation images).
Current usage metrics show cumulative count of Article Views (full-text article views including HTML views, PDF and ePub downloads, according to the available data) and Abstracts Views on Vision4Press platform.
Data correspond to usage on the plateform after 2015. The current usage metrics is available 48-96 hours after online publication and is updated daily on week days.
Initial download of the metrics may take a while.