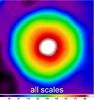
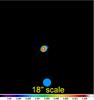
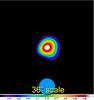
Fig. 8
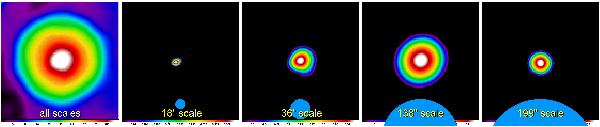
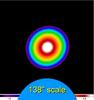
Evolution of sources in the clean single-scale images (Sect. 2.5). The full image of the source at 350 μm with a size of 3 7 × 37 (left) has been cut out of the corresponding panel in Fig. 2 (the source is located south-east of the image center, it is resolved in all wavebands). The other panels show the source in single-scale images ℐλDj C at the scales of 18, 36, 138, and 199′′, maximum intensities in the panels being 0.31, 0.89, 3.09, and 1.84 MJy/sr, respectively. The scale sizes Sj are visualized by the blue circles and annotated at the bottom of the panels. The color coding is a linear function of intensity.

Current usage metrics show cumulative count of Article Views (full-text article views including HTML views, PDF and ePub downloads, according to the available data) and Abstracts Views on Vision4Press platform.
Data correspond to usage on the plateform after 2015. The current usage metrics is available 48-96 hours after online publication and is updated daily on week days.
Initial download of the metrics may take a while.