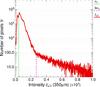
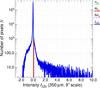
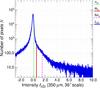
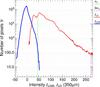
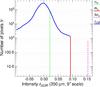
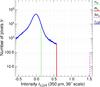
Fig. 5

Using skewness and kurtosis for iterating accurate thresholds ϖλj in the cleaning process (Sect. 2.3). The upper panels show histograms for the full image ℐλD at 350 μm (left) and for the decomposed images ℐλDj at the 9′′ and 36′′ scales (middle, right) before cleaning. The lower panels display histograms for the reconstructed residuals ℐλD R (left) and for the residuals ℐλDj R of the two decomposed images of the upper panels (middle, right). The vertical lines in the left panels indicate the standard deviation σλ (short dash, green) and 6 σλ (long dash, magenta) computed in the full image ℐλD. In the other panels they indicate the converged values of the standard deviation σλj and 6 σλj in the single-scale images ℐλDj, as well as the final thresholds ϖλj (solid, red). The histogram of the residuals ℐλD R of the cleaning process, reconstructed from all spatial scales (lower left) has much greater symmetry and resembles a Gaussian distribution, whereas the histogram of the full image ℐλD (red, copied from the upper-left panel) is highly asymmetric. Both  and
and  have a value of 3.17 and the corresponding variable factors nλj have the values of 4.52 and 4.09 for the two single-scale images. The width of the intensity bins is 1 MJy/sr in the left panels and 0.004 MJy/sr in all other panels.
Current usage metrics show cumulative count of Article Views (full-text article views including HTML views, PDF and ePub downloads, according to the available data) and Abstracts Views on Vision4Press platform.
Data correspond to usage on the plateform after 2015. The current usage metrics is available 48-96 hours after online publication and is updated daily on week days.
Initial download of the metrics may take a while.