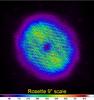
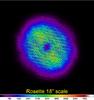
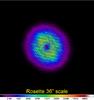
Fig. 4
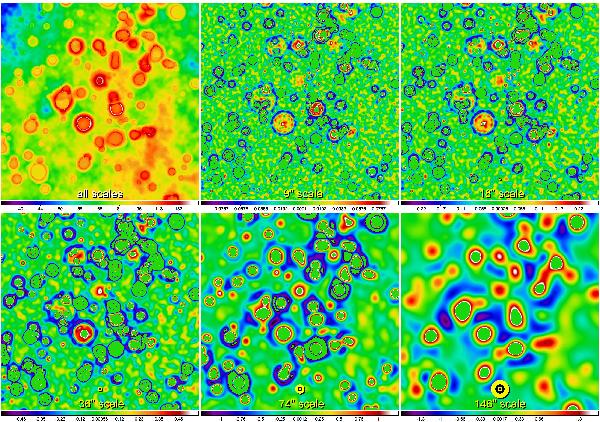
Single-scale cleaning residuals (Sect. 2.3). The field of Fig. 2 is shown as the reconstructed image ℐλD R of the residuals at 350 μm (upper left) that accumulates cleaning residuals from all scales. The same set of spatial scales is displayed in the single-scale images of the residuals ℐλDj R (left to right, top to bottom). The cleaning procedure left no significant intensity peaks of the simulated objects in the residuals, only the noise- and background-dominated pixels (cf. Fig. 7). The scale sizes Sj are visualized by the yellow-black circles and annotated at the bottom of the panels. The color coding is a linear function of intensity in MJy/sr.
Current usage metrics show cumulative count of Article Views (full-text article views including HTML views, PDF and ePub downloads, according to the available data) and Abstracts Views on Vision4Press platform.
Data correspond to usage on the plateform after 2015. The current usage metrics is available 48-96 hours after online publication and is updated daily on week days.
Initial download of the metrics may take a while.