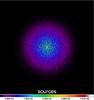
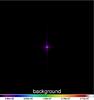
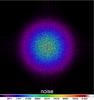
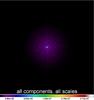
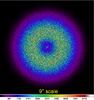
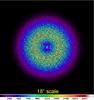
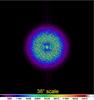
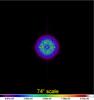
Fig. D.1

Fourier transform of the simulated star-forming region used in this paper (Appendix C) at 350 μm with a 24′′ resolution (Fig. 19, upper-left). The top panels show the Fourier amplitudes of separate components: the model sources, synthetic background, and noise (top left to right). The full image containing all the ingredients (and all spatial scales) is displayed in the following (middle-left) panel. The remaining panels (left to right, top to bottom) show the images of the single-scale decompositions of the simulated sky (cf. Fig. 2) with the scale sizes Sj annotated at the bottom of the panels. For the original images with 2048 × 2048 2′′ pixels, the panels present the Fourier amplitudes within the range of spatial frequencies from zero to one-fourth of the Nyquist frequency (0.25 arcsec-1). For better visibility, the pixel values are somewhat limited in range; the color coding is linear.
Current usage metrics show cumulative count of Article Views (full-text article views including HTML views, PDF and ePub downloads, according to the available data) and Abstracts Views on Vision4Press platform.
Data correspond to usage on the plateform after 2015. The current usage metrics is available 48-96 hours after online publication and is updated daily on week days.
Initial download of the metrics may take a while.