Fig. 24
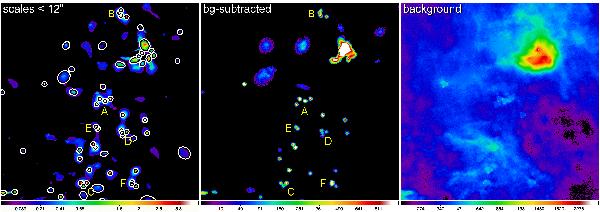
The Rosette sub-field is shown as the accumulated clean combined detection image containing spatial scales of up to 12′′ (left), obtained by summing up the single scales ℐDj C in that range, with the 160 μm ellipses of all detected sources overplotted. Also shown are the background-subtracted image ℐλO BS (middle) and clean background ℐλO CB (right) at 70 μm; when added together, they make up the original 70 μm image in Fig. 23. For better visibility, the values displayed in the panels are somewhat limited in range; the color coding is a function of the square root of intensity in MJy/sr.
Current usage metrics show cumulative count of Article Views (full-text article views including HTML views, PDF and ePub downloads, according to the available data) and Abstracts Views on Vision4Press platform.
Data correspond to usage on the plateform after 2015. The current usage metrics is available 48-96 hours after online publication and is updated daily on week days.
Initial download of the metrics may take a while.