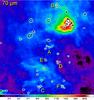
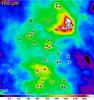
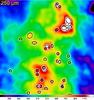
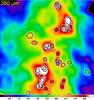
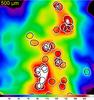
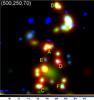
Fig. 23
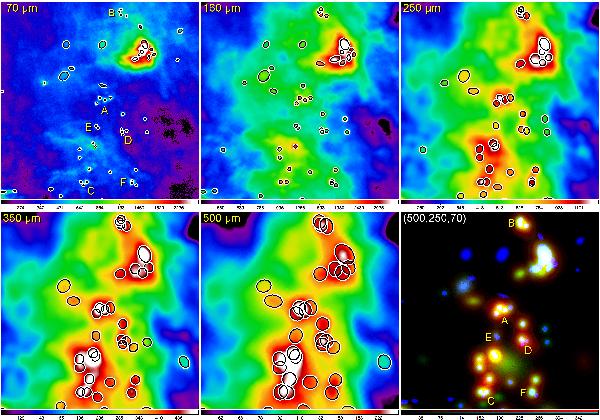
The Rosette sub-field (9′ × 9′) is shown as as the observed images ℐλO at 70, 160, 250, 350, 500 μm (left to right, top to bottom) with the extraction ellipses (FWHM) of only measurable sources (Fiλ P > σiλ P and Fiλ T > σiλ T) overlaid, as well as the composite 3-color RGB image (500, 250, 70 μm) created using the images ℐλM of the deblending shapes of each extracted source (lower-right). The default condition, that a tentatve source must be detected in at least two bands, was used. Most of the compact sources visible at 70 μm are unresolved protostars; several groups of them, discussed in Sect. 3.2, are labeled A–F. For better visibility, the values displayed in the panels are somewhat limited in range; the color coding in the lower-right panel is linear, in the other panels it is a function of the square root of intensity in MJy/sr.
Current usage metrics show cumulative count of Article Views (full-text article views including HTML views, PDF and ePub downloads, according to the available data) and Abstracts Views on Vision4Press platform.
Data correspond to usage on the plateform after 2015. The current usage metrics is available 48-96 hours after online publication and is updated daily on week days.
Initial download of the metrics may take a while.