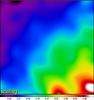
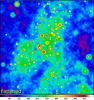
Fig. 19
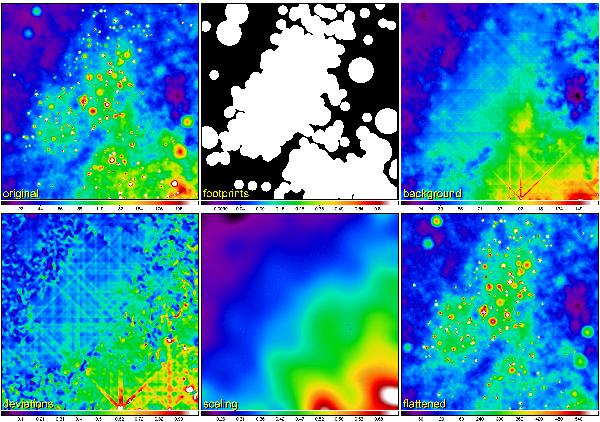
Flattening of the detection images (Sect. 2.8). The entire 1° × 1° simulated star-forming region at 350 μm is shown (upper left), the central area of which was used to illustrate getsources in this paper. The image  of the converged footprints ℱλ somewhat expanded by convolution (upper middle) is used to interpolate all detected sources off the image to obtain the clean background image (upper right). The image
  of the standard deviations (lower left) is computed in a very small (3 × 3 pixels) sliding window and further median-filtered using a 21 × 21 pixels sliding window to reduce effects of possible artifacts. The smoothed scaling image ℐλF (lower middle) is obtained by convolving the image in the previous panel with a circular Gaussian beam
  larger than the maximum size of sources extracted at 350 μm in the initial extraction. The resulting flattened image ℐλDF (lower right) is obtained by dividing the original image ℐλD by the scaling image ℐλF. For better visibility, the values displayed in the panels are somewhat limited in range; the color coding is a linear function of intensity in MJy/sr.

Current usage metrics show cumulative count of Article Views (full-text article views including HTML views, PDF and ePub downloads, according to the available data) and Abstracts Views on Vision4Press platform.
Data correspond to usage on the plateform after 2015. The current usage metrics is available 48-96 hours after online publication and is updated daily on week days.
Initial download of the metrics may take a while.