Fig. 17
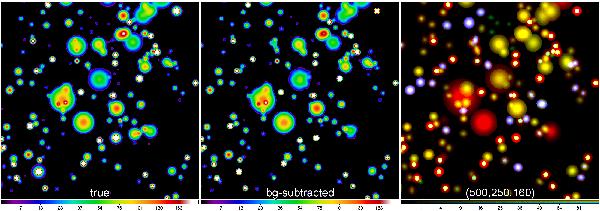
Background-subtracted sources (Sect. 2.6). The field of Fig. 2 is shown as the true intensities of the model sources at 350 μm convolved to a 17′′ resolution (left), the background-subtracted image ℐλO BS at 350 μm (middle), and the composite 3-color RGB image (500, 250, 160 μm) created using the images of the deblending shapes of each extracted source (right). For the true model intensity distribution (no background) to be more comparable to the background-subtracted image, it is shown above 5 MJy/sr. The color coding is a function of the square root of intensity in MJy/sr.
Current usage metrics show cumulative count of Article Views (full-text article views including HTML views, PDF and ePub downloads, according to the available data) and Abstracts Views on Vision4Press platform.
Data correspond to usage on the plateform after 2015. The current usage metrics is available 48-96 hours after online publication and is updated daily on week days.
Initial download of the metrics may take a while.