Fig. 16
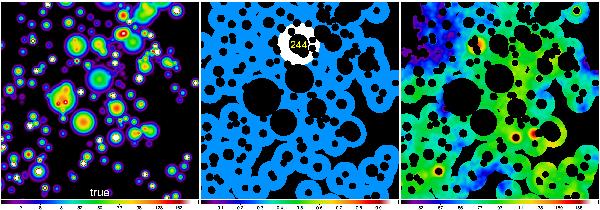
Annuli around measured sources (Sect. 2.6). The field of Fig. 2 is shown as the true intensities of the model sources at 350 μm convolved to a 17′′ resolution (left), the image of annuli  of all detected sources (middle) slightly modified to highlight the annulus area around the source 244 from Fig. 14, and the product
  (right) to visuaize the actual observed intensities used to compute the flux uncertainties σiλ P shown in Fig. 15. The corresponding footprint images ℱλ are presented in Fig. 15 and the observed image ℐλO is displayed in Fig. 18. The color coding in the left panel is a function of the square root of intensity, in the other panels it is a linear function of intensity in MJy/sr.

Current usage metrics show cumulative count of Article Views (full-text article views including HTML views, PDF and ePub downloads, according to the available data) and Abstracts Views on Vision4Press platform.
Data correspond to usage on the plateform after 2015. The current usage metrics is available 48-96 hours after online publication and is updated daily on week days.
Initial download of the metrics may take a while.