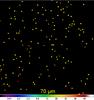
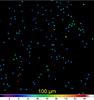
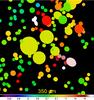
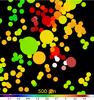
Fig. 15

Converged footprints of the measured sources (Sect. 2.6). The field of Fig. 2 is shown at 70, 100, 160, 250, 350, 500 μm (left to right, top to bottom) as the footprints of all detected sources after the measurement iterations. The pixel values are the standard deviations σiλ P, due to the local noise and background variations, estimated for each source in an elliptical annulus around its footprint (Fig. 16). Strongly elliptical or too large footprints may appear at those wavelengths where some sources are too faint to be measurable. For such sources, the information is essentially lost and the intensity moments cannot provide meaningful estimates of their sizes and orientation. The color coding is a function of the square root of intensity in MJy/sr.


Current usage metrics show cumulative count of Article Views (full-text article views including HTML views, PDF and ePub downloads, according to the available data) and Abstracts Views on Vision4Press platform.
Data correspond to usage on the plateform after 2015. The current usage metrics is available 48-96 hours after online publication and is updated daily on week days.
Initial download of the metrics may take a while.