Fig. 6
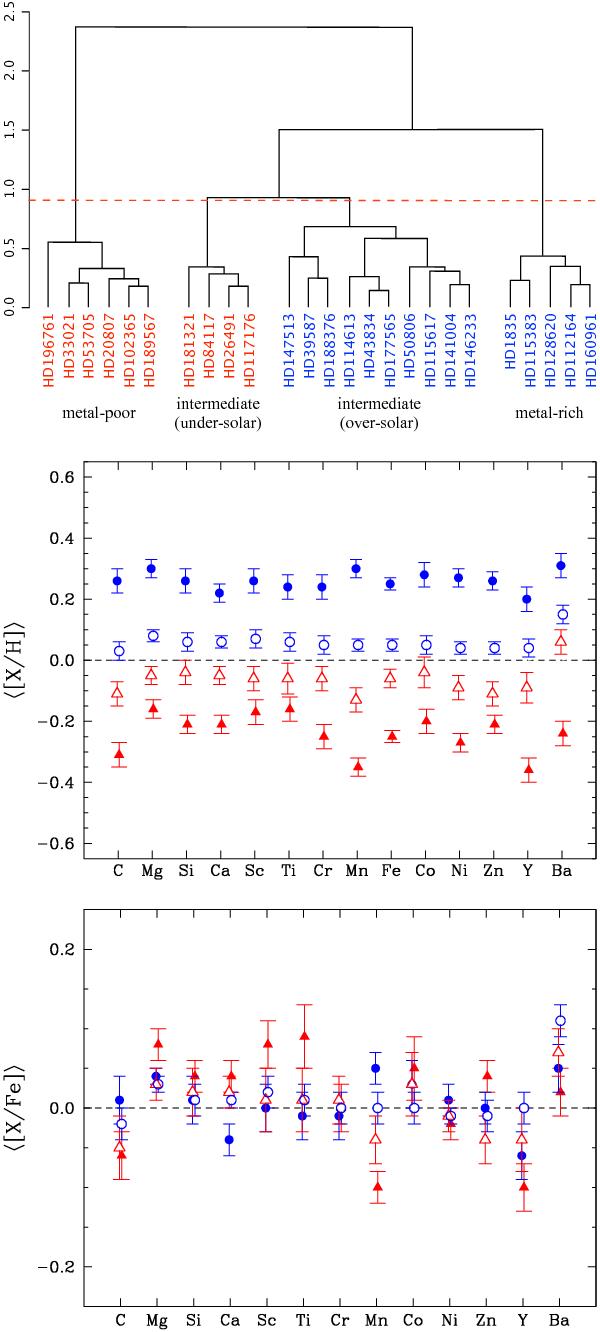
Dendrogram (upper panel) and mean abundance ratios ⟨ [X/H] ⟩ (middle panel) and ⟨ [X/Fe] ⟩ (bottom panel) for the four stellar groups from the tree clustering analysis (Sect. 5). They are classified as metal-poor (▴), intermediate abundance (under solar △ or over solar °), or metal-rich (•) stars, and the same symbolism is adopted all over the paper. The dashed red line on the dendrogram represents a dissimilarity number of 0.9 dex.
Current usage metrics show cumulative count of Article Views (full-text article views including HTML views, PDF and ePub downloads, according to the available data) and Abstracts Views on Vision4Press platform.
Data correspond to usage on the plateform after 2015. The current usage metrics is available 48-96 hours after online publication and is updated daily on week days.
Initial download of the metrics may take a while.