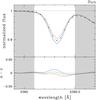
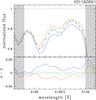
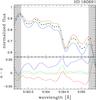
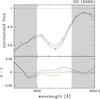
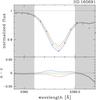
Fig. 2
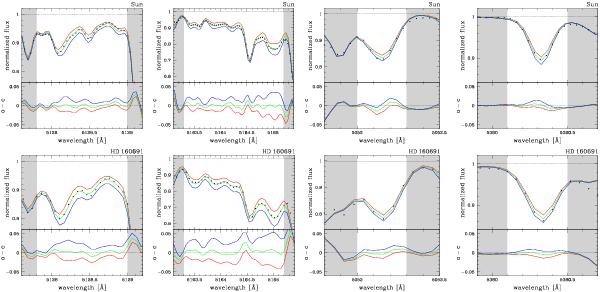
Spectral synthesis of the C2 molecular band regions (λ5128 and λ5165) and of the C atomic lines (λ5052.2 and λ5380.3) for Ganymede of the second observation run (top panels) and for one metal-rich star of the first run, HD 160691 (bottom panels). The solid lines represent three models with different values of [C/Fe]: −0.05 (red), 0.0 (green), and +0.05 dex (blue). The differences between observed (dots) and computed spectra (o−c) are also shown in the bottom of each panel.
Current usage metrics show cumulative count of Article Views (full-text article views including HTML views, PDF and ePub downloads, according to the available data) and Abstracts Views on Vision4Press platform.
Data correspond to usage on the plateform after 2015. The current usage metrics is available 48-96 hours after online publication and is updated daily on week days.
Initial download of the metrics may take a while.