Fig. 12
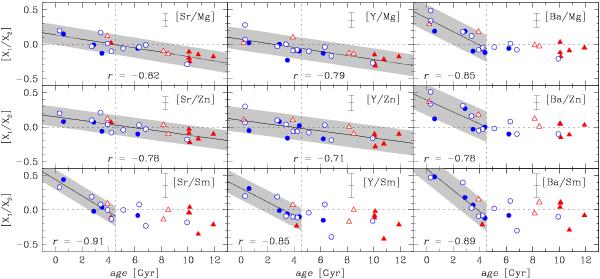
Abundance ratios as a function of the stellar age. The vertical dashed line indicates the adopted solar age (4.53 Gyr). The linear regressions (solid line), the 95% confidence intervals (hashed area), and the cross-correlation coefficients are also shown for |r| ≥ 0.5. The symbols follow the classification of Sect. 5 (see Fig. 6).
Current usage metrics show cumulative count of Article Views (full-text article views including HTML views, PDF and ePub downloads, according to the available data) and Abstracts Views on Vision4Press platform.
Data correspond to usage on the plateform after 2015. The current usage metrics is available 48-96 hours after online publication and is updated daily on week days.
Initial download of the metrics may take a while.