Fig. 4
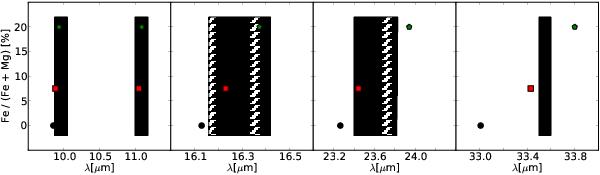
Peak positions of main emission features associated with crystalline olivine grains (9.8, 11, 16.2, 23–24, and 33 μm) as a function of the Fe fraction. Black circles, red squares, and green pentagons correspond to aerosol measurements of the pure forsterite, Mg-, and Fe-rich samples, respectively (Tamanai et al. 2006; Tamanai & Mutschke 2010). Hatched regions correspond to the range of peak positions in the observed spectra of HD 69830, HD 113766 A, ID 8, and HD 169666.
Current usage metrics show cumulative count of Article Views (full-text article views including HTML views, PDF and ePub downloads, according to the available data) and Abstracts Views on Vision4Press platform.
Data correspond to usage on the plateform after 2015. The current usage metrics is available 48-96 hours after online publication and is updated daily on week days.
Initial download of the metrics may take a while.