Fig. 9
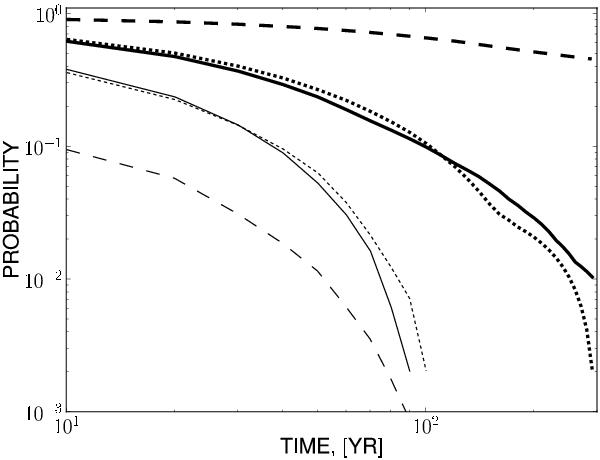
Probability of the high- and low-activity episodes for the given duration (see definition in the text). The thin lines show the results for the high-activity episodes, and the bold lines the low-activity episodes. The solid lines (thin and bold) show the results for 2D1α model, the dotted lines show the results for the 2D1αL model and the dashed lines show the same for the reconstruction data set provided by Solanki et al. (2004).
Current usage metrics show cumulative count of Article Views (full-text article views including HTML views, PDF and ePub downloads, according to the available data) and Abstracts Views on Vision4Press platform.
Data correspond to usage on the plateform after 2015. The current usage metrics is available 48-96 hours after online publication and is updated daily on week days.
Initial download of the metrics may take a while.