Fig. 8
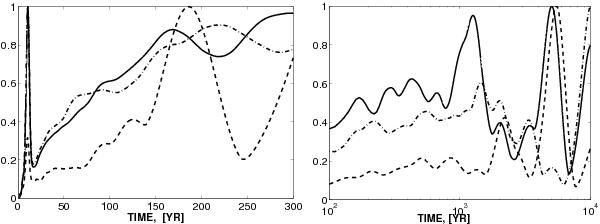
Wavelet spectra of the simulated and observational sunspot number data sets. The left panel corresponds to short time scales of up to 300 yr. The solid line shows the results for the 2D1α model, the dashed line is computed on the base of the data set provided by the Hoyt & Schatten (1998) reconstruction and the dash-dotted line shows the results for the 2D1αL model based on the log-normal fluctuations of the α-effect. The right panel is similar to the left one, but for longer time scales. The dashed line is computed on the basis of the reconstruction provided by Solanki et al. (2004). The spectra were normalized relative to their maxima for clarity.
Current usage metrics show cumulative count of Article Views (full-text article views including HTML views, PDF and ePub downloads, according to the available data) and Abstracts Views on Vision4Press platform.
Data correspond to usage on the plateform after 2015. The current usage metrics is available 48-96 hours after online publication and is updated daily on week days.
Initial download of the metrics may take a while.