Fig. 5
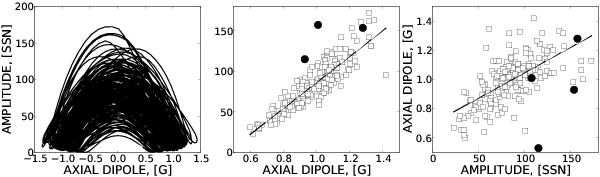
Left, the phase relation between the cycle amplitude and the strength of the dipole component of the dynamo generated magnetic field at the surface. Middle, correlation between dipole component at the cycle minimum and the amplitude of the subsequent cycle. Right, correlation between the amplitude of the cycle and the dipole component at the subsequent cycle minimum. The circles mark the results of the WSO observations and the SSN data.
Current usage metrics show cumulative count of Article Views (full-text article views including HTML views, PDF and ePub downloads, according to the available data) and Abstracts Views on Vision4Press platform.
Data correspond to usage on the plateform after 2015. The current usage metrics is available 48-96 hours after online publication and is updated daily on week days.
Initial download of the metrics may take a while.