Fig. 4
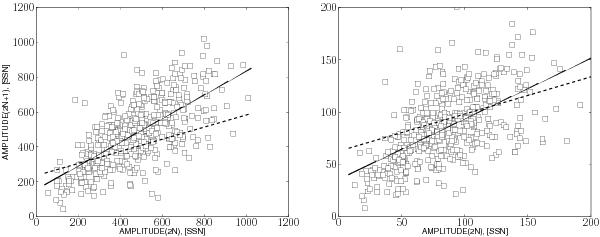
Odd-even cycle effect (Gnevyshev-Ohl rule): the left panel shows the effect that is calibrated on the base of the cycle amplitude, the right panel shows the effect that is calibrated on the basis of the SN integrated over the cycle. Squares show data for individual cycles, while the solid line gives the correlation, the dashed line shows these relations obtained from the actual SSN data.
Current usage metrics show cumulative count of Article Views (full-text article views including HTML views, PDF and ePub downloads, according to the available data) and Abstracts Views on Vision4Press platform.
Data correspond to usage on the plateform after 2015. The current usage metrics is available 48-96 hours after online publication and is updated daily on week days.
Initial download of the metrics may take a while.