Fig. 1
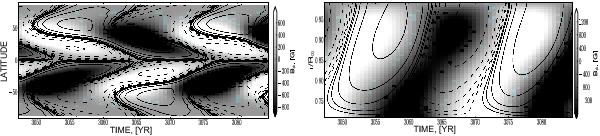
Typical time-latitude and time-radius (at the 30° latitude) diagrams of the toroidal field (gray scale), the radial field (contours at left panel) and the poloidal magnetic field (which is drawn by the contours of the vector-potential at the right panel) evolution in the 2D1α model (see Table 1). The toroidal field averaged over the subsurface layers in the range of 0.9−0.99 R⊙, the radial field is taken at the top of the convection zone.
Current usage metrics show cumulative count of Article Views (full-text article views including HTML views, PDF and ePub downloads, according to the available data) and Abstracts Views on Vision4Press platform.
Data correspond to usage on the plateform after 2015. The current usage metrics is available 48-96 hours after online publication and is updated daily on week days.
Initial download of the metrics may take a while.