Free Access
Fig. 9
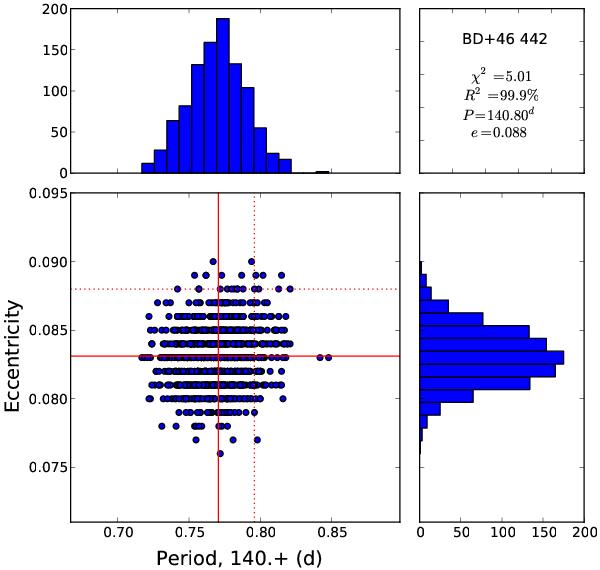
Distribution of the orbital period and eccentricity values obtained from 1000 simulated RV data sets. The solid cross marks the solution based on the observed RVs (see Table 2), while the dotted cross and the upper right panel show an alternative solution with a slightly better χ2 derived from the simulated RV data sets.
Current usage metrics show cumulative count of Article Views (full-text article views including HTML views, PDF and ePub downloads, according to the available data) and Abstracts Views on Vision4Press platform.
Data correspond to usage on the plateform after 2015. The current usage metrics is available 48-96 hours after online publication and is updated daily on week days.
Initial download of the metrics may take a while.