Fig. 5
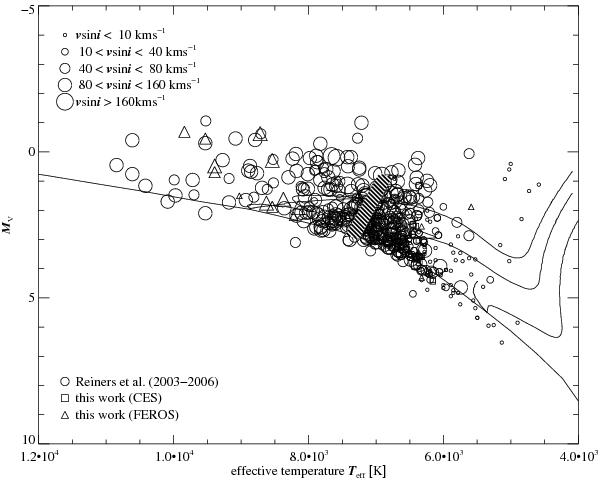
HR diagram with the stars from previous (circles) and the present (squares and triangles) work. Symbol size scales with projected rotational velocity measured by the FT method. The granulation boundary according to Gray & Nagel (1989) is indicated by the hashed region. Evolutionary tracks for 1.0, 1.5, and 2.0 M ⊙ and the early-main sequence of Siess et al. (2000, solid, Z = 0.02 are added, using bolometric corrections by Kenyon & Hartmann (1995, Table A5). Stars with photometry possibly affected by multiplicity (flags “x” and “m” in Tables 1 and 2) are not included.
Current usage metrics show cumulative count of Article Views (full-text article views including HTML views, PDF and ePub downloads, according to the available data) and Abstracts Views on Vision4Press platform.
Data correspond to usage on the plateform after 2015. The current usage metrics is available 48-96 hours after online publication and is updated daily on week days.
Initial download of the metrics may take a while.