Fig. 9
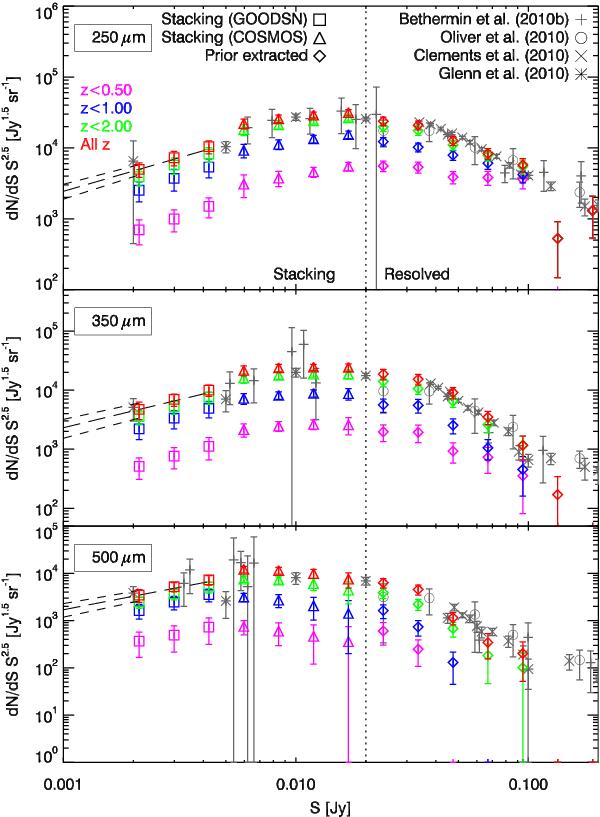
Number counts at 250 μm (top panel), 350 μm (middle panel), and 500 μm (bottom panel). The contribution of z < 0.5, z < 1, z < 2, and all sources are plotted in violet, blue, green and red, respectively. Squares: points from stacking in GOODS-N. Triangles: points from stacking in COSMOS. Diamonds: points measured from source extraction using priors. Vertical dotted line: 4-σ confusion limit. Long and short dashed lines: extrapolation of the counts and 1-σ confidence region (see Sect. 9.2.1). Plus symbols: Béthermin et al. (2010b) measurements using BLAST data. Circles: Oliver et al. (2010b) measurements from resolved sources in the HerMES science demonstration phase data (Herschel/SPIRE). Crosses: Clements et al. (2010) measurements from resolved sources in the SPIRE H-ATLAS science demonstration phase data (Herschel/SPIRE). Asterisks: Glenn et al. (2010) measurements from P(D) analysis of the HerMES science demonstration phase data (Herschel/SPIRE).
Current usage metrics show cumulative count of Article Views (full-text article views including HTML views, PDF and ePub downloads, according to the available data) and Abstracts Views on Vision4Press platform.
Data correspond to usage on the plateform after 2015. The current usage metrics is available 48-96 hours after online publication and is updated daily on week days.
Initial download of the metrics may take a while.