Fig. 2
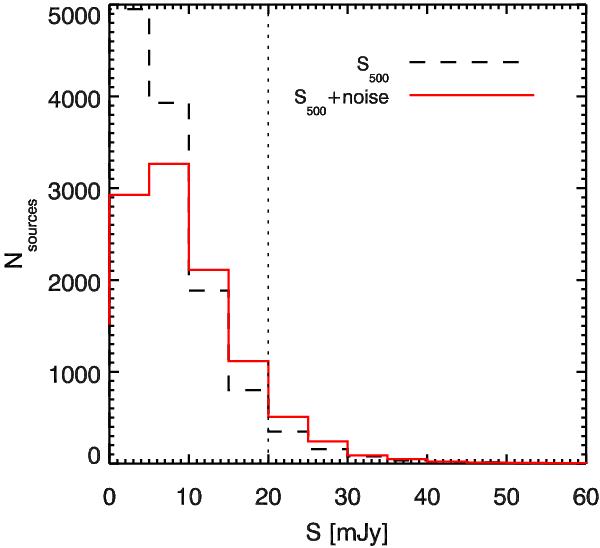
Effect of the photometric uncertainties in the flux density distribution at 500 μm. Black dashed line: distribution of the flux density measured at the position of the 24 μm sources. Red solid line: the same distribution after adding a 5.1 mJy random Gaussian noise to each measured flux density. Due to photometric noise, some sources have a negative flux density (put to zero in our iterative algorithm) and are not represented here. Black dotted line: flux density cut used in our analysis (20 mJy).
Current usage metrics show cumulative count of Article Views (full-text article views including HTML views, PDF and ePub downloads, according to the available data) and Abstracts Views on Vision4Press platform.
Data correspond to usage on the plateform after 2015. The current usage metrics is available 48-96 hours after online publication and is updated daily on week days.
Initial download of the metrics may take a while.